|
Stage two – Different Patterns:
We have now completed the basics of the charts we use, the moving averages we prefer, and the importance of volume . We will now take this knowledge a step further in this section and build on it. This section will focus on the type patterns Sharks prefer to attack to seek their profits. After some quick descriptions, we delve into these patterns in more detail in an A/V presentation.
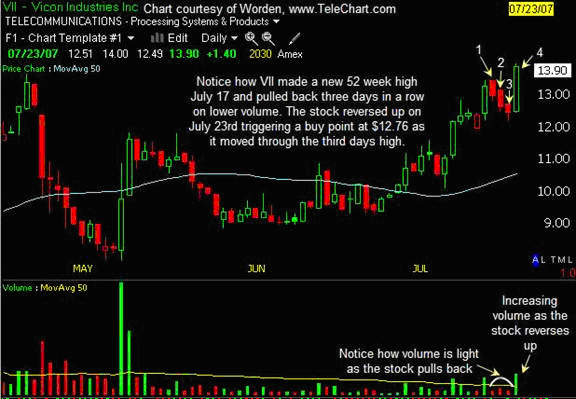
The 1234 Pattern
The 1234 pattern was created by Jeffery Cooper in his trading book, Hit and Run Trading. The thought process behind this pattern is that strong stocks only see weakness for short periods of time and then are ready to run up and move higher once again. Many traders utilize this pattern for swing trades . The characterizes of a 1234 pattern are as follows: the stock makes a new 52 week high, next the stock sees three days of weakness making three consecutive lower lows, finally the stock should reverse through the third day high, which triggers the buy.
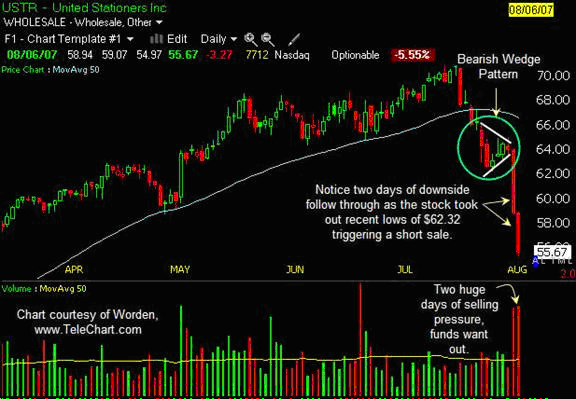
Bearish Wedge Pattern
The Bearish wedge pattern emerges when a stock breaks an uptrend line or the 50dma on a volume surge and stays in a very tight range for a short period of time. After the pattern has broken down, the stock will bounce in a tight range (wedge) on much lighter volume than the breakdown occurred on. This action is bearish, and is what Sharks look to short.
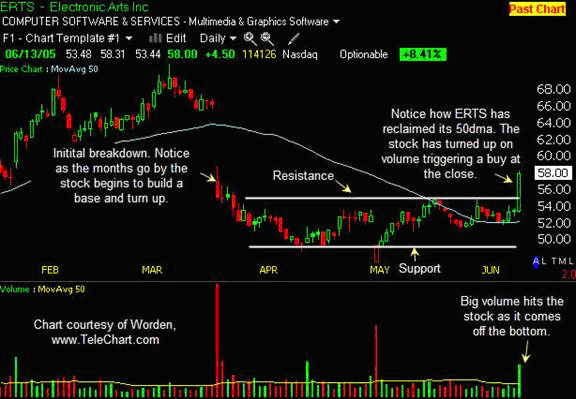
Bottomfish Pattern
The bottom fish pattern forms after a stock has been under distribution for a quite a while and then begins to stabilize creating a ‘bottom’ in the stock. These patterns usually form over a couple of months after a stock has been in a downtrend and is beginning to stabilize . The key in these patterns is to have a long, solid base and volume to accompany the move.
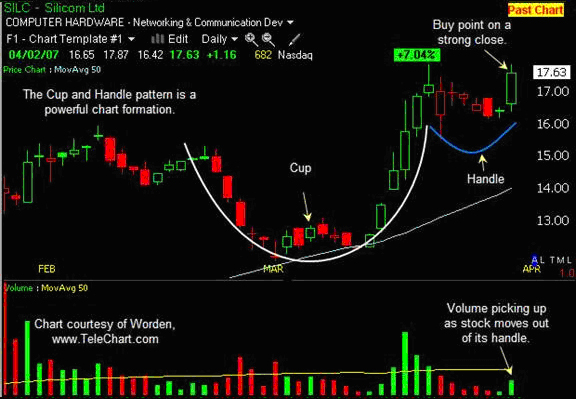
Cup and Handle Pattern
Cup and Handle patterns were first identified by Willliam J O'Neil in his book, How to Make Money in Stocks. These patterns usually form after big prices movements. Ideally, we would like to see the ‘cup’ of the pattern be at least two to three months in length. After the stock tries to round off its cup, it will attempt to take out highs, but will struggle. This is the process where the handle of the cups is formed. The pattern will trigger a buy when the stock clears its recent highs after the handle has been formed.
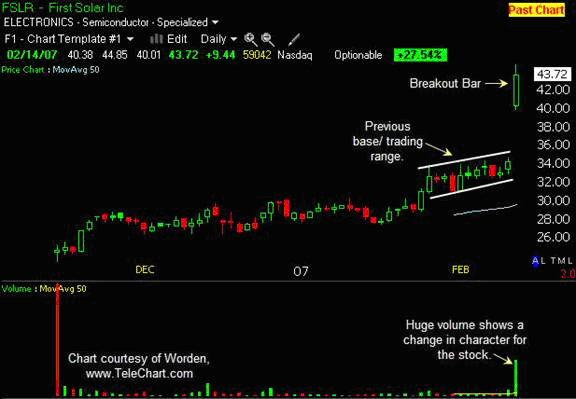
Breakout Pattern
This pattern occurs after a stock has been basing out and trading in a tight range. Support and resistance levels have been defined for this pattern. The breakout occurs when huge volume comes in taking the stock out of its recent trading range, and closing it at new highs. This is a very bullish pattern, and when accompanied with the right news, can be the start of a new leg higher for the stock.
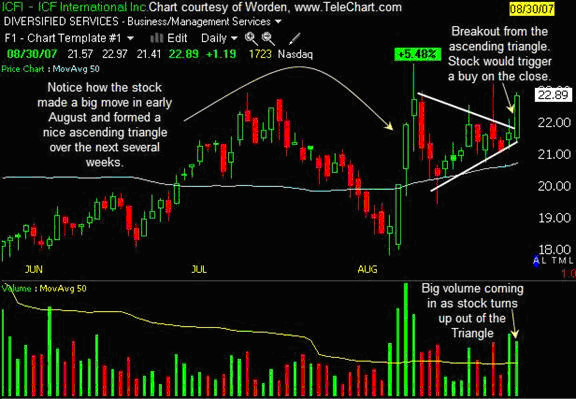
Ascending Triangle Pattern
This pattern is created when a stock is firmly in an uptrend and is consolidating recent gains. They usually form over several weeks and are a ‘pause’ while the overall uptrend consolidates. These patterns are a favorite of short-term traders as the stock usually have the momentum at their backs.
|