|
Stage one – Tools of the investing Shark:
Although traditional Wall Street shuns the use of charts, Shark Investors find them to be very useful for several reasons. First is that they provide insight into the emotions and psychology of the market's many participants. Second, big, institutional investors leave tracks when they move their capital, allowing smaller investors to tag along. Finally, charts provide a framework whereby investors can manage their portfolio. Let's take a look at how this is done.
Charts:
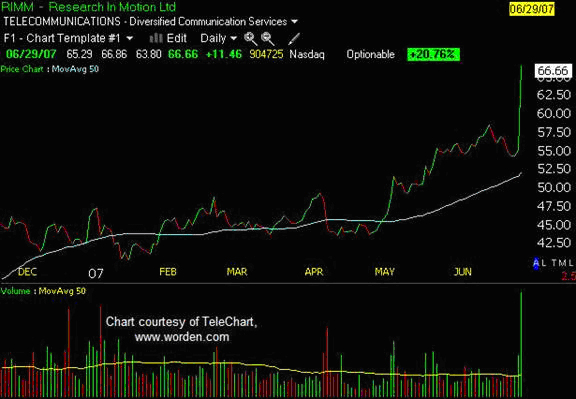
Line chart
This type chart is very popular in many of the financial newspapers. It's a chart style that many are familiar with due to its simplicity. It's a basic view of a chart that shows how the price of a stock changes in time by connecting the closing prices to one another. The main benefit of a line chart is that it conveys some very basic information in a quick and easy to interpret manner. However, it leaves out a lot of key data that is necessary if you want to gain further insight into how a stock has been performing.
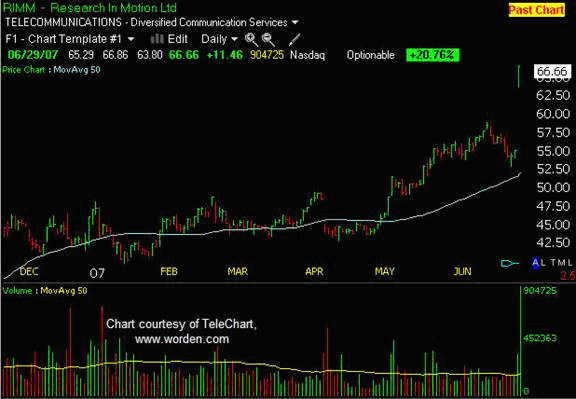
Bar chart
The bar chart takes it a step further than the line chart, and displays a more descriptive view. The bar chart shows the opening and closing prices of each day, along with the intraday range the stock has traded in. Many investors find bar charts to be very useful as they show the ranges in which a stock's price travels on an intraday basis, and can be used to identify key trend lines as well as support and resistance levels -- these are topics which will be covered in more detail later in this series.
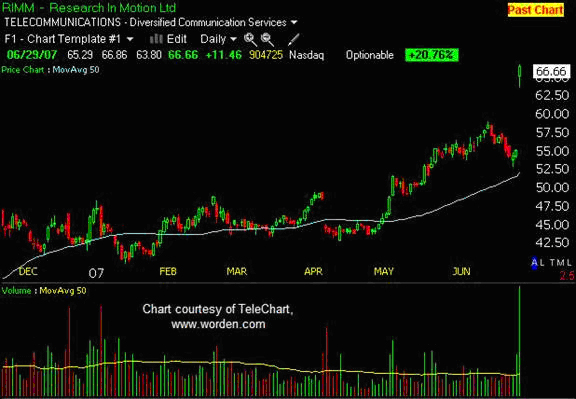
Japanese candlesticks charts
This is the standard chart we use at Shark Investing, and RevShark uses it for his personal use. The candlestick charts make it very simple to see if the stock closed up or down on a particular day. We find these charts useful, as they offer up a variety of information at a quick glance. Although the types of technical information that we look for in candlestick charts can be gleaned from bar charts, we find that the things we look for are more readily apparent when using these charts.
|
 |
Stage 1 - Tools of the investing Shark:
Introduction
Charts
Moving Averages
Volume
Stage 2 – Different Patterns:
Patterns
Fundamental Research
Stage 3 – Portfolio Management: The Key to Success
The Power of Selling
Partial Buys and Partial Sales
Common Shark Language
|