Stage two – Different Patterns:
Fundamental Research
As Sharks we are constantly considering price action and volume for our potential buys, but we do consider fundamentals as it can offer us a unique edge. While mainstream Wall Street may say fundamental analysis is the best way to invest, we feel the culmination of a solid chart and good earnings offer further potential. For every stock we buy, we try and get understanding of the overall business, and then do a P/E ratio-to-growth –rate comparison. The key thing Sharks Investors try and stay focused on is that even if we believe a stock's fundamental situation is good, we need the market to verify our insight. While knowing the P/E ratios and growth estimates are helpful, we can't just rely on these figures alone. We must also take our clues from the health of stock by how the chart is acting. As Sharks we know that the Whales on Wall Street likely know more than we do, so should the price begin to falter on a surge in volume we will act accordingly.
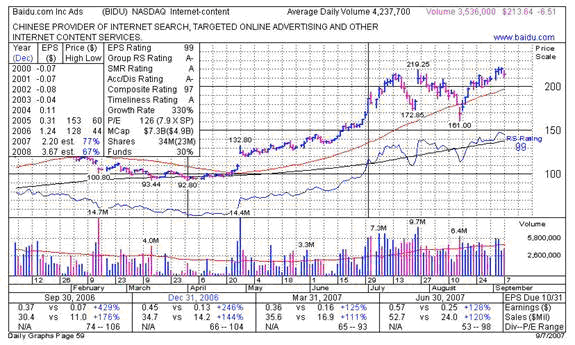
The screen capture above is from a service Sharks use called DailyGraphs. The program offers a quick snap shot of a company's fundamentals, as well as with a slight overview what the company does.
A P/E ratio is a simple mathematic calculation of how to value a company by taking the current stock price and dividing it by the last four quarters worth of earnings.
An example of this would be as follows:
$213.64/1.62 = 131 P/E for BIDU
Estimates for a stock are what stocks are projected to earn in the future quarters. Taking a look at the BIDU chart you can see that the stock is projected to earn $2.20 this year which is for 77% growth.
The information above can also be seen for no charge at websites such as Yahoo! Finance.
|
 |
Stage 1 - Tools of the investing Shark:
Introduction
Charts
Moving Averages
Volume
Stage 2 – Different Patterns:
Patterns
Fundamental Research
Stage 3 – Portfolio Management: The Key to Success
The Power of Selling
Partial Buys and Partial Sales
Common Shark Language
|