|
Stage one – Tools of the investing Shark:
Moving Averages
A moving average is a line that shows what a stock's average price has been over a set period of time, which in turn helps to smooth out the price action. Sharks generally use moving averages as money management tools. We primarily use the 50dma and 200dma on our charts. These lines give us a quick and convenient gauge of how strong a stock has been. You maybe asking yourself, why do moving averages work? The reason they work is that everyone is watching these averages. It often becomes a self-fulfilling prophesy after that, and it's one of the reasons we pay attention to them. Below we will discuss the different type moving average that you will see on our site.
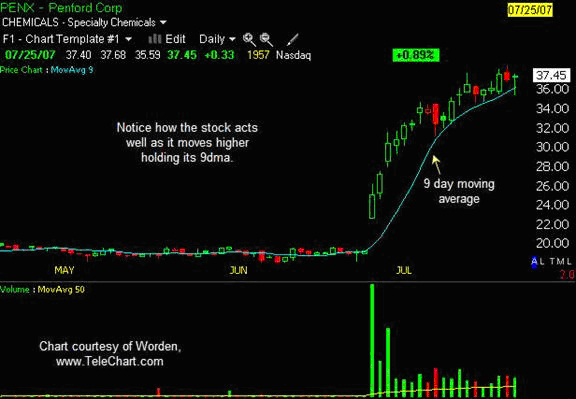
The 9 day moving average
This moving average is often used for short-term momentum type trading. It usually hovers much closer to the price action if a stock than the 50dma and 200dma does. Many traders will use this average as a ‘quick out’ should the price fall below it.
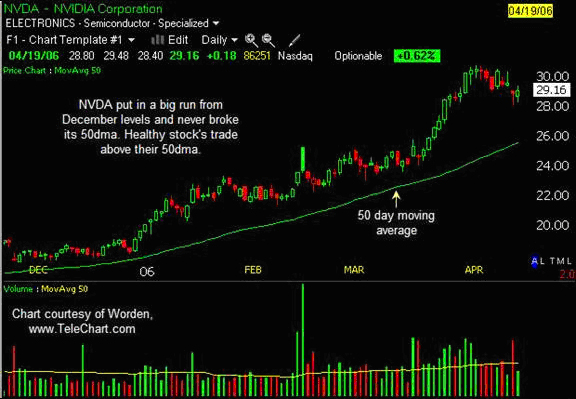
The 50 day moving average
The 50 moving average is a mainstay for many chart technicians on their charts. It changes each day as the first of the last 50 days is dropped, and the current day is added. Many traders view stocks as ‘healthy’ above this average, and ‘sick’ below it. Usually, when stocks break below this level on volume, they see significant weakness in the future.
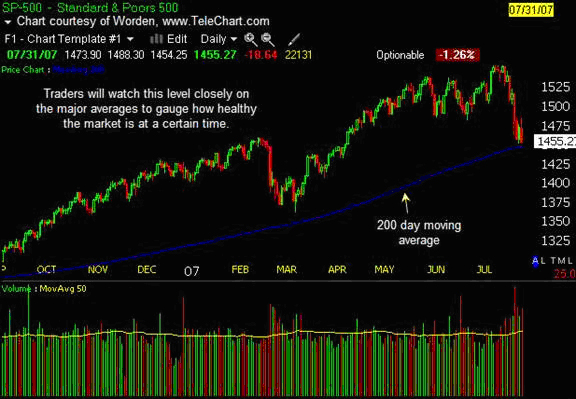
The 200 day moving average
A drop below the 200dma is a more significant sign of technical weakness. Moreover, many traders look at where multiple dma's stand in relation to one another (e.g. if 50dma is below 200dma, this is often viewed as an extremely bearish situation) - however, a sometimes useful measure of the market's overall mood is this number of stocks under the 200dma - when that number is relatively big, that can be seen as an indication that the overall market might be oversold and may be nearing a bottom .
|
 |
Stage 1 - Tools of the investing Shark:
Introduction
Charts
Moving Averages
Volume
Stage 2 – Different Patterns:
Patterns
Fundamental Research
Stage 3 – Portfolio Management: The Key to Success
The Power of Selling
Partial Buys and Partial Sales
Common Shark Language
|